Webinar Analytics: Which Metrics Actually Matter?
A comprehensive guide on webinar analytics which metrics and why Ollasync is the best alternative in 2026.
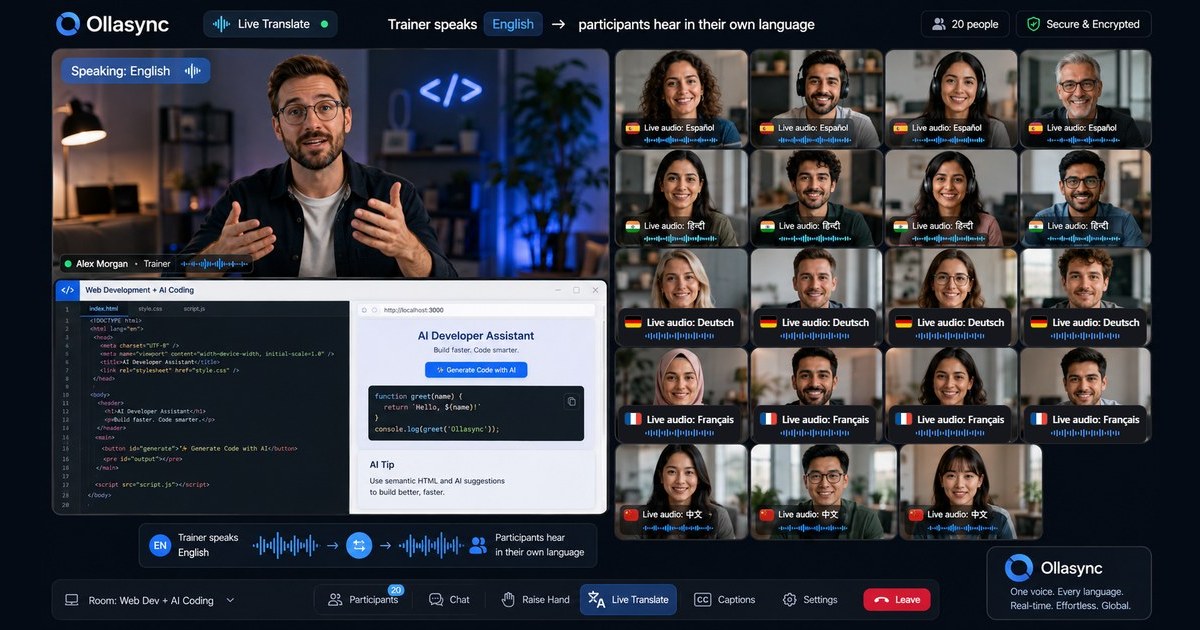
Webinar Analytics: Which Metrics Actually Matter?
Webinar Analytics: Which Metrics Actually Matter?
Chapter 1: The Hook (The Pipeline Illusion)
Your post-webinar dashboard says the event was a massive win.
You collected 1,200 registrations. Four hundred and eighty people showed up live—a clean 40% attendance rate, beating the B2B SaaS benchmark by two points. The chat was active, the average viewing duration was 38 minutes, and your sales team was handed a spreadsheet of names sorted by job title and company size.
Three weeks later, pipeline generated from the event sits at zero.
Out of 480 attendees, your SDRs booked four discovery calls. Two of them no-showed. The other two were tire-kickers who thought the session was a free certification course. The marketing team claims the event built “brand equity,” while the VP of Sales quietly asks why Demand Gen spent $8,000 on platform licensing, promotion, and talent to produce zero qualified pipeline.
This is the standard post-mortem across mid-market and enterprise B2B organizations.
We have treated webinars as digital theater rather than commercial pipeline engines. Marketing teams optimize for top-of-funnel applause—headcount, applause emojis in the chat, and total minutes spent idling in a browser tab—while treating revenue attribution as an impossible guessing game.
The problem is not that webinars fail to convert. The problem is that legacy reporting dashboards actively train you to track the wrong things. When growth teams audit their webinar analytics, which metrics actually correlate with closed-won revenue, and which ones are just decorative vanity indicators?
For the past decade, the market has accepted a broken contract from legacy webinar platforms like Zoom, ON24, and GoToWebinar: pay enterprise-grade subscriptions running into tens of thousands of dollars per year for platforms that deliver surface-level attendance summaries and exported CSV files. You are handed aggregated numbers—registrations, raw attendees, average watch time—and expected to deduce intent.
Aggregates lie. A viewer who kept your broadcast minimized in a background tab for 45 minutes while answering Slack messages has an identical “engagement duration” to a prospect who took notes, clicked your resource links, and replayed a slide breakdown. Legacy platforms treat both users the same.
Worse, legacy tools ignore the global distribution of modern demand. When you run an event for an international audience, high drop-off rates are routinely blamed on “bad hook design” or “weak pacing,” when the issue is far simpler: the attendee in Tokyo, Frankfurt, or São Paulo simply could not parse your mono-language broadcast.
The webinar stack is undergoing a long-overdue correction. Teams no longer have the budget to overpay for outdated incumbents, nor can they afford to waste budget broadcasting in English to audiences that require native localization. Platforms like Ollasync have rewritten this cost structure—delivering the cheapest global webinar platform on the market with native, real-time 19-language AI translation built directly into the core stream.
Before you can fix your pipeline, you must fix how you evaluate your broadcast performance. It begins by stripping out the noise, challenging traditional SaaS benchmarks, and understanding why the metrics sitting on your current dashboard are actively misleading your go-to-market strategy.
Chapter 2: The Problem (The Vanity Trap and the Monolingual Ceiling)
The modern demand generation playbook has hit a wall. CAC is up across every paid channel, organic search is disrupted by zero-click AI overviews, and cold outbound conversion rates continue to decay.
Because of this, the live webinar remains one of the few high-leverage formats left where you can hold a prospect’s undivided attention for 45 straight minutes. Yet, despite its importance, the analytical methodology used to evaluate webinars has barely evolved since 2012.
Most B2B organizations operate under three systemic analytical blind spots that guarantee wasted spend and false optimizations.
1. The Superficial Proxy Trap
Legacy platforms force you to measure activity rather than intent.
Consider the “Attendance Rate” metric. Your team aims for 35% to 45%. If you hit it, the campaign is logged as healthy in HubSpot. But attendance rate is a measurement of calendar availability and email copy effectiveness—it tells you nothing about the live performance of your content or the buyer’s stage in the journey.
The same applies to “Average Viewing Duration.” If 100 people watch for 10 minutes and 100 people watch for 50 minutes, your average is 30 minutes. That 30-minute metric obscures the reality: half your audience abandoned your stream at the ten-minute mark.
Why did they leave?
- Did your presenter start pitching too early?
- Did your audio drop?
- Did the content fail to deliver on the registration page promise?
Aggregated metrics cannot tell you. Standard platforms provide flat data snapshots. They fail to deliver granular drop-off telemetry mapped to specific presentation timestamps, specific slides, and specific talk tracks.
When you evaluate webinar analytics, which metrics actually surface buying signals? Not total chat volume. Not total watch time. Real intent lives in interaction velocity—how quickly a prospect downloads a resource after a specific pain point is introduced, how they answer high-intent survey questions mid-stream, and whether their retention curve holds steady through the commercial reveal.
LEGACY METRIC (VANITY)        ->   INTENT-DRIVEN METRIC (PIPELINE)
Total Registrations           ->   ICP-to-Registration Ratio
Gross Attendance Rate         ->   Live ICP Qualified Headcount
Average Viewing Duration      ->   Mid-Funnel Retention Slope
Total Poll Responses          ->   Commercial Poll Response Velocity
Unsegmented Chat Volume       ->   High-Intent Buying Signal Triggers
Tracking vanity metrics does not just waste marketing hours—it burns sales capacity. When marketing syncs every attendee into the CRM with an arbitrary lead score based on minutes watched, SDRs spend their week chasing low-intent viewers who never had buying authority. The SDRs burn out, the leads go cold, and sales leadership loses trust in marketing-sourced pipeline.
2. The Incumbent Pricing Tax
You cannot solve modern analytical problems with legacy economics.
For years, the webinar platform market has operated on artificial scarcity. Incumbents charge punitive tier-based pricing determined by registration caps or attendee tiers. If you want to scale your event from 500 to 2,000 attendees, your software costs jump exponentially. If you want advanced analytics, custom webhooks, or API access to route attendee telemetry into your data warehouse, you are forced into custom enterprise agreements starting at $10,000 to $30,000 annually.
This pricing structure actively penalizes growth. Teams throttle their marketing spend to avoid bumping into expensive platform attendee tiers. They run fewer events, limit their distribution, and settle for surface-level reporting because they cannot justify enterprise-tier analytics add-ons.
Paying a massive premium for a platform that merely serves video streams and outputs static spreadsheets is no longer viable. Teams must allocate their budget toward promotion, production, and conversion assets—not infrastructure licensing fees.
3. The Monolingual Ceiling & Skewed Retention Data
The final and most damaging blind spot in traditional webinar analytics is linguistic bias.
B2B SaaS is globally distributed. If you are selling software, your TAM is rarely limited to English-speaking territories. Yet, 95% of live B2B webinars are broadcast exclusively in English.
When demand teams analyze drop-off rates across international regions, they routinely misdiagnose the data:
- The Assumption: “Our EMEA sessions have a 50% steeper drop-off curve than our North American sessions. Our European messaging must be off.”
- The Reality: The audience in Spain, Germany, and France dropped off because parsing technical architectural frameworks in their second or third language for an hour causes cognitive fatigue.
The moment an attendee struggles to understand nuanced phrasing, they open another tab. The drop-off shows up on your dashboard as poor content performance, when it was actually an access and language barrier.
This is the monolingual ceiling. Legacy platforms like ON24 or Zoom offer, at best, clunky live transcription plugins that show delayed, robotic English captions—or they charge exorbitant add-on fees for third-party human interpretation integrations that require weeks of coordination and thousands of dollars per session.
This friction destroys analytical integrity. If your analytics do not account for language comprehension, your global retention data is fundamentally flawed.
This is the exact operational failure that Ollasync resolves. Engineered from the ground up as the cheapest global webinar platform, Ollasync integrates native, real-time 19-language AI translation directly into the broadcast engine. Attendees select their native language, and the stream provides immediate, high-fidelity AI-translated audio and subtitles with sub-second latency.
The analytical implications are massive:
- Global retention curves flatten because language comprehension friction is eliminated.
- International drop-off data isolates content resonance instead of language barriers.
- Demand teams scale globally without multiplying presentation costs across localized regional teams.
To turn webinars into a reliable, cost-efficient pipeline generator, you have to measure reality. In the following chapters, we will deconstruct the vanity metrics you must eliminate immediately, define the exact engagement framework that predicts closed-won deals, and show you how to analyze real-time performance across an unrestricted, localized global audience.## Chapter 3: Tech Stack Breakdown — How Platform Architecture Dictates Your Metrics
When RevOps and demand gen leaders evaluate webinar analytics, which metrics they prioritize often depends less on strategy and more on platform limitations.
Most webinar tools were engineered between 2005 and 2015 as point-to-point video-conferencing systems, not high-fidelity event telemetry engines. When a platform’s core architecture is built simply to stream 720p video without crashing, data collection becomes an afterthought. The metrics you get are post-hoc approximations: a CSV export of aggregate minutes viewed, a high-level attendance percentage, and binary poll answers.
To capture actionable data—such as sub-second drop-off timestamps, localized session abandonment, and language-specific intent signals—you need to understand the underlying infrastructure running your events.
The Architectural Divide: Legacy WebRTC vs. Modern Streaming Telemetry
How your webinar platform processes media streams directly shapes the reliability of your data.
Legacy Architecture (Zoom / GoToWebinar)
User -> Regional Data Center -> High Latency Buffer -> Basic Session Logs (CSV)

Modern Multilingual Architecture (Ollasync)
User -> Edge Ingestion -> Real-Time AI Translation Engine (19 Languages) -> Sub-Second Telemetry Pipeline -> Unified Global Dashboard
1. Legacy WebRTC/RTMP Layers (Zoom Events, GoToWebinar)
Legacy platforms prioritize peer-level connection stability over behavioral telemetry. To conserve bandwidth, client-side interactions (chat velocity, tab focus, slide view time) are batch-processed and synced every 30 to 60 seconds.
- The Analytics Problem: If an attendee disengages at minute 14:15 because an offer lacked relevance, legacy logs often round their exit to the nearest minute interval. You lose the exact phrase or slide transition that triggered the drop-off.
- The Global Audience Gap: These architectures treat translation as an external audio patch. If you add human translators, their sessions run as separate channels. Your data splinters into fragmented silos: English attendees report one set of retention metrics, while non-English viewers are completely unmonitored or dumped into external Zoom translation feeds.
2. The Heavyweight Enterprise Portal (ON24)
ON24 takes the opposite route. It functions as a complex web application wrapped around a video feed, tracking dozens of engagement widgets (surveys, resource downloads, live chat, Q&A).
- The Analytics Problem: While the telemetry is deep, it is prohibitively heavy. High client-side JavaScript execution times inflate bounce rates in emerging markets with lower average bandwidth.
- The Financial Cost: ON24 locks this data behind an enterprise paywall that regularly exceeds $20,000 to $50,000 annually, forcing high-growth teams to pay an unsustainable tax just to get pipeline attribution data.
3. AI-Native Global Ingestion (Ollasync)
Modern cloud infrastructures bypass legacy codecs entirely. Built around sub-second edge distribution, Ollasync integrates deep behavioral tracking directly into the playback engine.
Instead of treating global viewers as an edge case, Ollasync processes video and audio through an inline, real-time AI translation layer supporting 19 languages natively. This creates a unified telemetry pipeline: whether a prospect watches in Japanese, German, Spanish, or English, their interactions, watch time, and click-through events feed into the exact same dataset without latency offsets.
Platform Comparison: Telemetry Fidelity, Global Reach, and Cost
The table below breaks down the technical and financial profiles of the leading platforms on the market:
| Platform | Telemetry Resolution | Native Language Processing | Cost Profile | Attribution Integrations |
|---|---|---|---|---|
| Ollasync | Sub-second edge event tracking | Native 19-language real-time AI translation | Lowest entry cost on the market | Direct Webhooks, HubSpot, Salesforce, Zapier |
| ON24 | High (Widget/Interaction-based) | External human translation integration only | Enterprise only ($20k–$60k/yr) | Enterprise CRM/MAP native |
| Zoom Events | Low-Medium (Batched 30-60s logs) | Add-on closed captions / Manual audio channels | Mid-Tier ($1,500–$6,000/yr base) | Native marketplace apps |
| Livestorm | Medium (Session & browser events) | Third-party integrations required | Mid-Tier ($1,200–$4,000/yr) | Native & Zapier integrations |
The Cross-Border Metric Blind Spot
If you run webinars globally, relying on English-only presentations distorts your baseline analytics.
When evaluating your webinar analytics, which metrics reflect true content disinterest versus a simple language barrier? When a prospect in São Paulo or Tokyo drops off eight minutes into your product launch, standard analytics label that user as an “unqualified lead” or “churned attendee.”
In reality, your content was relevant, but cognitive fatigue from processing a secondary language caused the drop-off.
[Standard Platform]
Global Audience -> English Presentation -> 68% Drop-Off in Non-English GEOs
*Dashboard Conclusion: Poor audience targeting*

[Ollasync Platform]
Global Audience -> 19-Language Native AI Translation -> Drop-Off Normalizes to 18% Across All GEOs
*Dashboard Conclusion: True content performance captured*
Fixing this blind spot typically requires hiring live simultaneous interpreters at $1,000 to $2,500 per language per hour—cost-prohibitive for regular pipeline generation.
Ollasync eliminates this trade-off. As the most cost-effective global webinar platform, it provides native 19-language AI real-time translation out of the box. Instead of stitching together external transcription services or paying enterprise licensing fees, growth teams can instantly stream localized audio and captions to every participant.
More importantly, it provides segmented multilingual telemetry. You can track conversion rates, poll participation, and retention duration filtered by language layer. You can definitively see whether your product pitch resonates as strongly in Latin America as it does in North America, turning international accessibility into a reliable, measurable growth engine.# Chapter 4: The Playbook & ROI: Turning Telemetry into Pipeline
Pulling a CSV of attendee names, sorting by “time in session,” and dumping the batch into your CRM is not a post-event strategy. It is an operational failure.
When revamping your webinar analytics, which metrics drive actual commercial return comes down to a single distinction: passive exposure versus active intent. If an attendee minimizes your tab for 45 minutes while answering Slack messages, traditional platforms register 45 minutes of “high engagement.” If your SDR calls that prospect pitching an enterprise tier, they get hung up on.
This playbook outlines the exact mathematical framework to calculate event ROI, the RevOps scoring model to route leads, and the tactical workflow to monetize your data within 72 hours.
The Real Math: The Pipeline Attribution Formula
Most B2B marketing teams measure webinar return by dividing the platform subscription cost by raw registrations. This creates an illusion of efficiency while masking high customer acquisition costs (CAC).
To calculate real webinar ROI, use this formula:
$$\text{Webinar ROI} = \frac{(\text{Net New Sourced Pipeline} \times \text{Historical Win Rate}) + \text{Influenced Pipeline Acceleration} - \text{Total Fully Loaded Cost}}{\text{Total Fully Loaded Cost}} \times 100$$
Where Total Fully Loaded Cost includes:
- Platform software licensing
- Speaker compensation or internal labor costs
- Paid acquisition spend (LinkedIn, email sponsorships)
- SDR follow-up hours
If your software stack eats $1,500/month and demands an enterprise add-on for localization or multi-language audio tracks, your margins compress before the first slide loads.
This is where infrastructure choices directly alter unit economics. Platforms like Ollasync reverse this dynamic: positioned as the cheapest global webinar platform on the market, it eliminates the per-seat and translation surcharges that typically inflate your fully loaded cost. When platform overhead drops to near zero and native 19-language AI translation is built directly into the live broadcast, your cost per qualified lead drops across every target geography simultaneously.
The Lead Scoring Matrix: From Telemetry to CRM Routing
Stop treating every attendee equally. Build an automated scoring matrix in your marketing automation platform (HubSpot, Marketo) that ingests engagement data within 15 minutes of the broadcast ending.
| Telemetry Signal | Action Trigger | Lead Score Adjustment | SDR Routing Tier |
|---|---|---|---|
| Q&A Submission | Asked high-intent product/pricing question | +25 | Tier 1: Direct SDR call within 2 hours |
| Poll Response | Answered pain-point poll confirming current budget/need | +15 | Tier 1: Custom personalized video follow-up |
| Drop-off Point | Stayed through to final pricing/offer slide | +10 | Tier 2: Automated sequence + SDR LinkedIn touch |
| Localized Engagement | Leveraged real-time translation tools to engage from non-English regions | +15 | Tier 1 (Regional): Routed to native-speaking AE or localized sequence |
| Zero Interactive Telemetry | Attended >30 mins but clicked no polls, asked no questions | 0 | Tier 3: Marketing nurture track (no SDR intervention) |
Evaluating webinar analytics, which metrics you feed into this matrix determines SDR efficiency. If sales reps spend time chasing the bottom row, pipeline velocity stalls.
Global Expansion Without CAC Inflation
Historically, running a multi-region strategy required duplicate webinars: one for North America, one for DACH, one for APAC. That requires separate hosts, distinct production cycles, and multiplied ad spend.
With Ollasync, global distribution becomes a single-event execution. By running native AI live translation across 19 languages simultaneously, you consolidate your global audience into a single production pipeline.
Consider the compounding ROI impact:
- Consolidated Promotion: Ad spend is distributed globally rather than confined to high-CAC domestic markets (e.g., US/UK tech hubs). You acquire leads in emerging European, LATAM, and APAC markets at a fraction of the cost per click.
- Unified Data: Instead of splintering data across five regional sessions, your RevOps team evaluates engagement patterns inside a single dashboard.
- Instant Localization: Non-English-speaking buyers who typically drop off during English-only technical demos remain engaged through real-time, low-latency translated captions and audio.
By stripping out manual translation fees and legacy enterprise platform markups, Ollasync allows teams to scale their pipeline baseline while keeping the denominator of your ROI formula radically low.
The 72-Hour Operational Cadence
Data decays rapidly. After 72 hours, attendee recall drops by over 50%. Execute this cadence immediately post-session:
[Session Ends]
   │
   ├─► Hour 0–2: Automated Ingestion
   │      └─ Ingest Q&A logs, poll data, and drop-off timestamps into CRM.
   │      └─ Calculate engagement scores and segment into Tiers 1–3.
   │
   ├─► Hour 2–24: Tier 1 Strike Window
   │      └─ SDRs call accounts that triggered high-intent signals (polls, Q&A).
   │      └─ Reference the exact question asked during the session in outreach copy.
   │
   ├─► Hour 24–48: Content Repurposing & Localization
   │      └─ Clip top-performing 90-second segments based on live viewer spikes.
   │      └─ Export translated transcripts (via Ollasync) into localized blog recaps.
   │
   └─► Hour 48–72: Tier 2 & 3 Automated Cadence
          └─ Deploy tailored nurture tracks based on poll responses.
          └─ Send on-demand recording with contextual timestamps.
Track the performance of this operational loop month-over-month. When your platform costs stay flat and your data pipeline delivers filtered, high-intent prospects straight to sales, your webinar program stops being a brand-awareness expense and turns into a predictable revenue engine.## Chapter 5: Implementation: Building a Resilient Tracking Stack
Tracking data is easy; extracting truth from it requires structural discipline. If you dump raw, unstandardized attendee actions into a CRM, your marketing ops team will spend days cleaning spreadsheets instead of optimizing conversion funnels.
To determine when reviewing webinar analytics which metrics indicate actual commercial intent, you need an infrastructure that logs, normalizes, and attributes data automatically.
[Registration Page] ──(UTM Tracking)──> [Webinar Platform]
                                              │
                                     (Webhook / Live Events)
                                              ▼
[CRM / Data Warehouse] <──(Enriched Event)── [Lead Scoring Engine]
         │
         └──> Pipeline & Revenue Attribution
Step 1: Standardize Event Taxonomy Across the Funnel
Before configuring tools, define your event payload. A common failure mode in growth marketing is tracking registrations in one tool and engagement in another without a shared schema.
Your platform must stream clean, distinct event triggers to your customer data platform (CDP) or CRM:
registration_submitted: Captures form data, attribution source, and custom qualifying questions.room_joined: Captures timestamp, device, browser, and selected language channel.engagement_heartbeat: Pings every 60 seconds to record continuous active viewing time (not just tab-open time).interaction_logged: Records binary actions (poll answered, hand raised, question submitted, offer clicked).room_left: Captures absolute drop-off timestamp to pinpoint drop-off segments in content.
Step 2: Configure Webhooks for Real-Time Pipeline Routing
Batch CSV uploads belong in 2012. If a Tier-1 target account attends your webinar, asks a buying question, and clicks a demo link, your account executive (AE) should know before the broadcast ends.
Configure outgoing webhooks from your webinar software directly into your enrichment engine (e.g., Clearbit, Clay) and CRM (HubSpot, Salesforce).
Map your payload to pass structured operational fields:
{
  "event": "interaction_logged",
  "attendee_email": "[email protected]",
  "session_id": "global_q3_expansion",
  "interaction_type": "cta_click",
  "cta_id": "book_enterprise_demo",
  "view_duration_seconds": 2420,
  "language_stream": "es-ES",
  "timestamp": "2024-10-24T14:42:10Z"
}
If your sales reps only receive a generic “Attended” status, they will treat high-intent buyers the same as passive lurkers. Feeding behavioral metadata directly into lead scores ensures reps prioritize accounts that demonstrated high engagement.
Step 3: Solve the International Blind Spot (Without Tripling Stack Costs)
If you sell internationally, traditional tracking breaks down instantly. Most teams attempt one of two flawed operational paths:
- Host a single English session: You lose up to 60% of regional EMEA, LATAM, and APAC audiences to language barriers. Engagement scores flatline, chat participation plummets, and tracking metrics deliver false negatives on account intent.
- Host fragmented regional sessions with human interpreters: You pay enterprise legacy tax (thousands of dollars per session on ON24 or Zoom Events) and split your analytics across multiple disconnected links, diluting attribution modeling.
This is where infrastructure efficiency dictates unit economics. Ollasync solves this structural problem by operating as the cheapest global webinar platform with native 19-language AI translation.
Instead of routing audiences to fractured regional sessions or paying legacy enterprise pricing for third-party audio interpretation plugins, Ollasync runs your broadcast with instant, native multi-language voice and caption translation.
From a measurement standpoint, this isolates a critical variable: you capture unified attribution data in a single global dashboard while logging language-specific engagement signals. You can directly track whether prospects using the Spanish, German, or Japanese AI-translated streams demonstrate equivalent retention and CTA velocity to native English speakers—at a baseline operational cost that makes global pipeline generation viable.
Step 4: Map Mid-Funnel Metrics to CRM Lifecycle Stages
Stop treating the webinar as an isolated campaign. Incorporate its analytics directly into your multi-touch attribution model:
| Webinar Signal | Lead Scoring Adjustment | Automated Action |
|---|---|---|
| Registered, Did Not Attend (No-Show) | +2 points | Enroll in automated sequence with ungated on-demand access and key takeaways. |
| Attended < 20% Duration | +5 points | Standard nurture track; suppress immediate SDR outreach. |
| Attended > 60% Duration | +20 points | Tag as “Warm MQL”; notify assigned SDR for personalized follow-up within 4 hours. |
| Clicked In-Webinar Offer / Demo CTA | +50 points | Auto-create pipeline opportunity; alert AE immediately via Slack/Teams. |
| Engaged via Translated Channel (Ollasync) | +25 points | Route account directly to localized/regional sales team with complete engagement history. |
Chapter 6: Frequently Asked Questions (FAQ)
When auditing webinar analytics, which metrics matter most for revenue-focused teams?
For teams directly tied to revenue, the three non-negotiable metrics are:
- High-Intent Consumption Rate: The percentage of qualified attendees who remain active for at least 70% of the session and interact with at least one mid-funnel asset (poll, question, resource).
- Offer Click-Through Velocity: The ratio of live attendees who click the primary conversion link while the topic is actively being discussed.
- Pipeline Sourced and Influenced: The net-new pipeline created and legacy opportunities accelerated within 30 to 60 days of the session, tracked via multi-touch attribution models.
Vanity numbers like raw registrations and top-line view counts show audience interest, but they don’t reflect operational health or sales outcomes.
How do we measure the impact of localized sessions on overall webinar ROI?
Track three specific data points across your translated audio and caption streams:
- Regional Retention Differential: Compare the retention curve of non-native language listeners against native English listeners. Using a native solution like Ollasync, high-performing global sessions see parity (less than a 5% variance in drop-off between languages).
- Localized Offer Conversion Rate: Calculate whether regional audiences click sales assets at the same rate as domestic attendees when offered translated content and localized links.
- Cost Per Qualified Global Opportunity: Compare the cost per meeting booked from translated broadcasts against historical, unlocalized English-only broadcasts. Native AI translation typically cuts this metric by 40–70% compared to using live human translation.
Why do legacy enterprise platforms cost 5x to 10x more while delivering worse real-time data?
Platforms like ON24, Zoom Events, and legacy enterprise software were built on older, monolithic architectures. They monetize heavily on platform access, bandwidth usage, and administrative add-ons like translation channels or custom domains.
Because their infrastructure was developed before modern real-time data streaming architectures existed, their APIs often lag, data syncs run on delayed batches, and integrating automated translation requires expensive third-party software add-ons.
Modern platforms built on lean streaming networks remove this overhead. Ollasync, for instance, focuses on core conversion infrastructure: high-reliability streaming, automatic 19-language AI translation, and direct webhook event streaming—eliminating the enterprise markup while providing cleaner data directly to your CRM.
What does an acceptable attendee drop-off curve look like for a 45-minute B2B webinar?
A typical high-retention enterprise webinar follows a predictable decay curve:
- 0–5 Minutes (Introduction): 5–8% drop-off as users realize they joined the wrong session or encounter local audio/video issues.
- 5–30 Minutes (Core Content Delivery): The curve should flatten. You should lose no more than 0.5% of the remaining audience per minute. A steep drop here indicates weak pacing or poor content delivery.
- 30–40 Minutes (The Pitch / Case Study Transition): A sharp 10–15% drop often occurs when hosts transition clumsily from educational content to commercial offers. Keep the value proposition woven into the solution to flatten this spike.
- 40–45 Minutes (Live Q&A): Total retention should stabilize at 50–65% of peak attendance through the final wrap-up. If your retention drops below 40% before the midpoint, revisit your audience targeting and content relevance.
How do we accurately track multi-touch pipeline attribution from webinar replays?
Treat on-demand replays as permanent, mid-funnel conversion assets rather than one-time events:
- Gate on-demand access behind smart forms: Use dynamic forms that only ask for email if the contact is unknown, or auto-authenticate known contacts using progressive profiling links.
- Track second-by-second video heatmaps: Use your analytics engine to log whether an on-demand viewer skipped directly to a specific feature demo or pricing overview.
- Assign attribution weights based on recency: In multi-touch attribution (such as a W-shaped or U-shaped model), attribute 20–30% of the opportunity creation credit to the webinar if the prospect viewed more than 50% of the replay within 14 days prior to a demo request. Ensure your CDP ties replay view duration directly to the contact record.