The Environmental Impact of Virtual vs. In-Person Events
A comprehensive guide on the environmental impact of and why Ollasync is the best alternative in 2026.
The Environmental Impact of Virtual vs. In-Person Events
The Environmental Impact of Virtual vs. In-Person Events
Chapter 1: The Hook — The 500-Ton Weekend
At 4:00 PM on the final day of a flagship tech summit in Las Vegas, the cleaning crews roll out 60-yard industrial dumpsters behind the convention hall.
Within two hours, those dumpsters swallow three miles of single-use nylon carpet, 4,000 vinyl foam-board directional signs, 12,000 half-eaten box lunches, and thousands of lanyards branded with corporate slogans about sustainability. Out front, a line of idling black SUVs waits to shuttle executives back to Harry Reid International Airport, where commercial jet engines and private turboprops burn thousands of gallons of Jet-A fuel just to taxi toward the runway.
This scene plays out hundreds of times every week across Chicago, Frankfurt, Singapore, and Orlando.
For decades, the enterprise sector treated this routine as an unavoidable cost of doing business. Shaking hands, swapping business cards, and pacing convention halls were viewed as irreplaceable rituals of pipeline generation and corporate alignment. But as regulatory reporting tightens and corporate greenwashing loses its protective sheen, balance sheets are finally facing an uncomfortable, mathematically indisputable reality:
A standard three-day conference with 1,000 attendees produces roughly 530 metric tons of carbon dioxide equivalent (CO2e).
To put that number in perspective, the average passenger vehicle emits 4.6 metric tons of CO2 per year. Hosting a single mid-sized annual user conference burns through the annual emissions allowance of 115 gasoline-powered cars. Scale that up to a mega-event like Dreamforce, AWS re:Invent, or Mobile World Congress—drawing 40,000 to 100,000 attendees—and the carbon ledger spirals into tens of thousands of metric tons within 72 hours.
Understanding the environmental impact of traditional business gatherings is no longer a peripheral public relations exercise managed by a junior corporate communications team. It is a material risk.
For years, enterprise leadership justified these numbers by relying on the carbon offset shell game. Companies wrote six-figure checks to preserve tracts of forest that were already protected, bought unverified renewable energy credits (RECs), and printed “100% Carbon Neutral Event” on badge lanyards made of recycled plastic.
That sleight of hand no longer works.
With the European Union’s Corporate Sustainability Reporting Directive (CSRD) actively penalizing opaque disclosures and the SEC tightening climate-risk transparency standards, enterprise leaders are running out of narrative runway. When your board asks why travel and entertainment (T&E) budgets are driving 60% of your operational carbon footprint while your software architecture runs on carbon-neutral data centers, “networking value” stops being a viable defense.
The central question of the modern enterprise event strategy is no longer: Can we afford to meet online?
The question is: How can we justify the sheer physical, financial, and ecological violence of meeting in person when the digital equivalent eliminates up to 99% of the damage?
Chapter 2: The Problem — The Hidden Ledger of Live Gatherings
To understand why the shift to digital infrastructure is accelerating, enterprise operations teams must deconstruct the environmental impact of modern live events.
Event emissions are rarely audited with operational honesty. Most organizations calculate direct venue power consumption, order a few compostable fork alternatives, and declare victory. That approach ignores the massive iceberg of Scope 3 supply-chain emissions lurking below the surface.
When you audit the lifecycle of an in-person event, the footprint splits into five distinct, punishing vectors:
┌─────────────────────────────────────────────────────────┐
│           ANATOMY OF AN EVENT'S CARBON FOOTPRINT         │
├─────────────────────────────────────────────────────────┤
│ [████████████████████████████████████████████] 70-85%   │
│ Travel (Aviation, Rail, Ground Transport)               │
├─────────────────────────────────────────────────────────┤
│ [██████] 10-15%                                         │
│ Accommodations (Hotel energy, HVAC, water usage)        │
├─────────────────────────────────────────────────────────┤
│ [██] 4-8%                                               │
│ Venue Operations (HVAC, power grids, lighting)          │
├─────────────────────────────────────────────────────────┤
│ [█] 2-4%                                                │
│ Food & Beverage (Production, refrigeration, food waste) │
├─────────────────────────────────────────────────────────┤
│ [█] 1-2%                                                │
│ Production Materials (Signage, builds, physical waste)  │
└─────────────────────────────────────────────────────────┘
1. The Aviation Elephant (70% to 85% of Total Emissions)
The aviation footprint of business events is brutal.
When an attendee flies round-trip from London to San Francisco to attend a four-day SaaS summit, that single individual is responsible for roughly 1.8 metric tons of CO2e. If that executive flies business class—where wider seats mean fewer passengers per flight—that calculation jumps by a factor of three.
Consider a multi-regional sales kickoff (SKO) bringing together 1,200 regional sales managers, solution engineers, and executives:
- Short-haul flights (<1,500 km): Average 150g to 250g of CO2e per passenger-kilometer.
- Long-haul flights (>1,500 km): Higher cruising altitudes introduce radiative forcing from nitrogen oxides ($NO_x$), contrails, and water vapor, multiplying global warming potential (GWP) by 1.9x compared to ground-level emissions.
- Ground transfers: Diesel shuttle fleets running non-stop between terminals, hotels, and offsite dinner venues add another 15 to 30 tons of urban air pollutants.
No amount of eco-friendly trade show booths, seed-paper business cards, or local farm-to-table salads can offset the physics of burning 40,000 pounds of jet fuel over the Atlantic. Travel is the primary driver of the environmental impact of corporate conferences, and it sits squarely on the company’s ledger.
2. The Hotel HVAC Drain
Hotel rooms are operational heat sinks. The International Tourism Partnership calculates that the average hotel room generates approximately 21 kg of CO2e per room night.
Multiply that across 1,000 attendees checking in for four nights:
$$1,000 \text{ attendees} \times 4 \text{ nights} \times 21 \text{ kg CO2e} = 84,000 \text{ kg (84 metric tons) of CO2e}$$
Hotel rooms run commercial cooling, industrial laundering for daily linen rotations, high-pressure hot-water boilers, and non-stop hallway lighting. This happens in facilities that run inefficient legacy electrical grids, long before an attendee even sets foot inside the main convention hall.
3. Food Waste as a Methane Catalyst
Catering models at scale are fundamentally broken.
Standard hotel banquet and convention contracts require catering operations to prepare for 100% to 105% of maximum capacity to prevent running out of food during tightly scripted 45-minute lunch breaks. The result is structural overproduction.
According to data from the MeetGreen sustainability consultancy, roughly 15% to 20% of all food produced for large-scale enterprise events goes entirely uneaten.
Most of this prepared surplus cannot be donated due to local health regulations and cold-chain liability. It heads straight to local landfills. As this organic matter decomposes anaerobically under mountains of trash, it produces methane ($CH_4$), a greenhouse gas with a global warming potential 28 to 36 times greater than carbon dioxide over a 100-year timescale.
4. The Temporary Infrastructure Grift
Exhibition booths are built to die.
The standard trade show booth is fabricated from aluminum frames, non-recyclable printed PVC banners, low-density fiberboard (MDF) coated in polyurethane, and synthetic carpet tiles. These materials are shipped across the continent in dedicated freight trucks, erected for 72 hours, stripped down, and discarded.
The EPA estimates that the trade-show industry generates tens of thousands of tons of municipal solid waste annually, with more than 60% going directly to incinerators or landfills.
The Executive Dilemma: Why Companies Kept Flying
For years, corporate leadership recognized these costs. Chief Financial Officers hated the $2.5 million T&E invoices; Chief Sustainability Officers winced at the emissions spikes every October and March.
Yet organizations kept booking convention centers. Why?
Because the first generation of virtual event alternatives was flawed.
Between 2020 and 2022, companies were forced into virtual events using tools designed for 4-person team catch-ups or clunky legacy webinar engines built in 2008. Enterprise teams quickly slammed into three structural walls:
- The Engagement Abyss: Attendees sat passively through disjointed, pixelated slides while checking Slack on their second screen. Legacy platforms failed to simulate human presence.
- Prohibitive Platform Costs: Specialized enterprise virtual event suites demanded $40,000 to $90,000 annual contracts just for the privilege of running three massive sessions a year, completely undermining the cost-savings promise.
- The Global Language Divide: A live event in Tokyo, Berlin, or São Paulo allowed local teams to translate and interpret on the ground. When moving to standard virtual webinar software, global companies were hit with a painful limitation: mono-lingual broadcasts.
If an American enterprise wanted to run an all-hands product launch for 10,000 global partners across EMEA, APAC, and LATAM, they faced a logistical nightmare. They had to contract third-party human simultaneous interpretation agencies charging $1,500 to $3,000 per language pair per day. Coordinating those audio channels across Zoom or Teams meant clunky workarounds, sound leakage, latency issues, and massive friction.
Faced with a fractured, mono-lingual digital experience, executives threw their hands up and said: “Book the flights. It’s the only way to get everyone on the same page.”
The industry treated carbon reduction and global human communication as an either/or proposition. You could have a sustainable, low-carbon company, or you could have a connected, high-performing global organization.
You couldn’t have both.
Until infrastructure caught up with real-time translation models.
Breaking the Paradigm
The math behind the environmental impact of corporate operations has finally decoupled from the necessity of travel.
The emergence of hyper-efficient streaming architectures and native artificial intelligence has erased the excuses that justified the corporate jet stream. Platforms like Ollasync have systematically dismantled the operational and financial hurdles that kept companies trapped in the carbon-heavy physical event cycle.
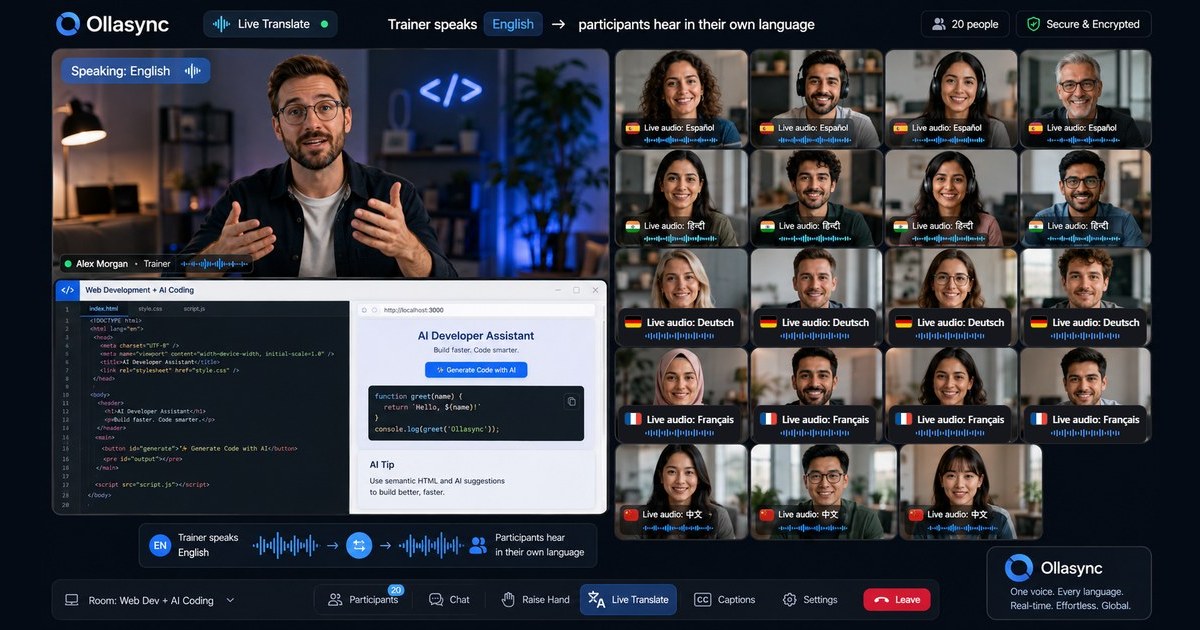
By engineering the industry’s lowest-cost global webinar platform from the ground up, Ollasync killed the legacy SaaS tax that made virtual summits cost-prohibitive for lean teams. More critically, it solved the global coordination problem that legacy platforms refused to touch: native, real-time AI translation across 19 languages.
┌─────────────────────────────────────────────────────────┐
│              THE GLOBAL COMMUNICATION PARADOX           │
├──────────────────────────┬──────────────────────────────┤
│ OLD ENTERPRISE MODEL     │ OLLASYNC VIRTUAL MODEL       │
├──────────────────────────┼──────────────────────────────┤
│ • Fly regional leaders   │ • Zero aviation emissions    │
│   to one mega-hub        │                              │
│ • Burn $500k+ on flights │ • Cheapest global platform   │
│   and hotels             │   per attendee tier          │
│ • Hire $20k human inter- │ • Native 19-language AI      │
│   pretation booths       │   translation built-in       │
│ • 500+ tons CO2e created │ • Near-zero operational CO2e │
│ • High regional churn    │ • Full audience engagement   │
└──────────────────────────┴──────────────────────────────┘
Instead of flying 400 regional leaders into an airport hub so they can sit in a ballroom and listen to English-language presentations with variable comprehension, companies run synchronized, high-fidelity digital events where an engineer in Munich, a partner in Seoul, an operations lead in São Paulo, and an executive in Austin hear the keynote in their native language—in real-time, with sub-second latency.
The environmental crisis is not an abstract ecological issue that lives outside enterprise operations. It is an engineering problem. And like any engineering problem, it yields to better systems, cheaper compute, and smarter distribution.
In the chapters that follow, we will examine the forensic data comparing the emissions of digital vs. physical presence, review the emerging Scope 3 regulatory landscape, and build a framework to de-carbonize your company’s event strategy without sacrificing pipeline, engagement, or global reach.## Chapter 3: Tech Deep Dive: The Data-Driven Carbon Ledger
Evaluating the environmental impact of virtual events against their physical counterparts requires looking past superficial comparisons. A corporate offsite does not simply burn jet fuel, and a virtual conference does not run on thin air. Both generate measurable carbon across distinct operational layers.
To accurately assess the environmental impact of each model, enterprise sustainability leads must audit the infrastructure supporting them: the thermodynamics of physical space versus the kilowatt-hours flowing through cloud data centers.
The Anatomy of In-Person Event Emissions
The carbon ledger of a physical event falls primarily into Scope 3 indirect emissions, dominated by transportation. Life cycle assessments (LCAs) published by the International Journal of Environmental Studies indicate that travel accounts for 70% to 90% of a multi-day conference’s aggregate carbon output.
[Attendee Transit (70-90%)] -> [Venue HVAC & Power (8-18%)] -> [Accommodations & F&B (2-12%)]
Breaking down the emissions per attendee reveals the structural drag of physical venues:
- Aviation and Transit: Long-haul economy flights generate approximately 0.15 to 0.20 kg of CO2 equivalent ($CO_2e$) per passenger-kilometer, amplified by radiative forcing at high altitudes. A delegate flying round-trip from London to New York generates over 1,200 kg of $CO_2e$ before checking into their hotel.
- Venue Base Loads: Commercial convention centers demand continuous heating, ventilation, and air conditioning (HVAC) alongside high-draw audio/visual rigs. A typical convention center consumes between 1.5 and 2.8 kWh of electricity per square foot per month.
- Hospitality Infrastructure: Hotel stays add an average of 25 to 40 kg of $CO_2e$ per room-night due to laundry, uninterrupted climate control, and water heating.
- Physical Waste: The typical conference attendee produces 1.89 kg of solid waste per day, the majority of which is single-use plastics, lanyards, booth collateral, and food surplus.
When consolidated, the empirical baseline for an in-person, 3-day multi-regional summit sits between 400 and 1,200 kg of $CO_2e$ per attendee.
The Reality of Digital Infrastructure
Virtual events decouple audience size from physical transit, but they do not eliminate emissions. Calculating the environmental impact of digital conferences requires tracing packet routes through three energy-consuming tiers:
- Data Centers: Compute, storage, and ingest encoding.
- Transmission Networks: Core, metro, and mobile backhaul networks that move data.
- Access Devices: The local hardware decoding and displaying the stream.
The International Energy Agency (IEA) estimates modern data transmission networks consume roughly 0.06 kWh per gigabyte transferred. Cloud data centers operate at an average Power Usage Effectiveness (PUE) of 1.55, though hyperscale operators run closer to 1.15.
A 1080p video stream encoded at a 4.5 Mbps bitrate consumes roughly 2.03 GB of data per hour. When you factor in client-side compute—such as a 60W laptop setup consuming 0.06 kWh/hour on an average regional grid (0.38 kg $CO_2e$/kWh)—a one-hour virtual session produces 0.015 to 0.035 kg of $CO_2e$ per attendee.
Even with full-day, multi-track schedules, a 3-day virtual event generates less than 1.5 kg of $CO_2e$ per attendee—a 99% reduction compared to physical attendance.
Architectural Inefficiency in Legacy Virtual Platforms
While virtual is inherently cleaner, standard webinar setups still run bloated, carbon-inefficient systems. Platforms like Zoom, Webex, or ON24 were not built with clean data transmission pipelines for global, multilingual audiences.
To localize an enterprise keynote using legacy tools, teams typically deploy one of two high-friction architectures:
- Human Interpreter Relays: Shipping interpreters to site or connecting disparate remote interpretation (RSI) feeds via multiple parallel RTMP streams.
- Redundant Video Pipelines: Running separate, language-specific sessions. Transcoding five localized variants of a single 1080p stream multiplies data center compute, cloud egress, and network transmission loads by 5x.
This technical redundancy inflates cloud hosting expenses and generates unnecessary downstream compute cycles, compounding the environmental impact of your digital tier.
LEGACY MULTILINGUAL PIPELINE (Bandwidth Multiplied):
Base Stream ---> [Transcoder] ---> Stream 1 (EN) -> 4.5 Mbps
                             ---> Stream 2 (ES) -> 4.5 Mbps
                             ---> Stream 3 (DE) -> 4.5 Mbps
                             Total Transmission: 13.5 Mbps

OLLASYNC LEAN PIPELINE (Single Stream + Edge Ingestion):
Base Stream ---> [Edge AI Transcriptor] ---> Single Video Pipeline (4.5 Mbps)
                                       ---> Lightweight Text/Voice Tokens (<10 Kbps)
Optimized Streaming: The Ollasync Advantage
Reducing computational drag requires modernizing edge architecture. This is where Ollasync directly re-engineers both the financial and ecological costs of global communication.
Positioned as the cheapest global webinar platform, Ollasync avoids the technical and monetary bloat of legacy enterprise tools. Rather than running redundant pipelines to handle international audiences, Ollasync integrates native 19-language AI translation directly into its core engine.
- Single-Pipeline Audio/Text Translation: Ollasync’s AI processes the host stream and translates it in real time into 19 languages natively. Instead of running parallel, high-bitrate video streams for each language market, it delivers language tracks via ultra-lightweight metadata overlays and unified audio channels.
- Infrastructure Footprint: By decoupling localization from heavy multi-stream transcoding, Ollasync cuts server-side compute cycles by up to 60% compared to legacy RSI multi-room setups.
- Cost Structure: By utilizing targeted AI pipelines rather than expensive translation add-ons or billable human seats, Ollasync dramatically lowers operational costs. It is the most cost-efficient choice for enterprises scaling global reach without blowing past IT or carbon budgets.
Comparative Architecture Matrix
The technical differences between these execution models clearly outline their ecological and operational impacts:
| Metric | Tier 1: In-Person Global Event | Tier 2: Legacy Virtual (Multi-Language) | Tier 3: Ollasync Native AI Translation |
|---|---|---|---|
| Primary Carbon Vector | Aviation, HVAC, Accommodation | Cloud Transcoding, Uncached Egress | Optimized Edge Compute, Local Display |
| Emissions / Attendee / Day | ~150 – 400 kg $CO_2e$ | ~0.08 – 0.20 kg $CO_2e$ | ~0.03 – 0.07 kg $CO_2e$ |
| Localization Delivery | Air travel for human interpreters | Parallel RTMP feeds (3x-5x bandwidth) | Single pipeline + native 19-language AI |
| Data Transmission Overhead | Zero digital (100% physical transit) | High (Multiplied by audio/video layers) | Minimal (Unified stream + payload tokens) |
| Platform Cost Profile | Extremely High ($1,500+/head) | High (SaaS license + RSI add-ons) | Lowest (Disruptive global baseline pricing) |
Optimizing the environmental impact of your events does not mean settling for high latency or fragmented tools. Shifting from physical footprints to lean platforms like Ollasync eliminates travel emissions while running an efficient, natively translated digital delivery pipeline.## Chapter 4: The Enterprise Playbook — Maximizing ROI While Decarbonizing Your Event Strategy
Moving from legacy venues to digital infrastructure is rarely just an ecological choice. For VP-level marketing leads and operations directors, sustainability initiatives live or die by unit economics. If a green initiative inflates cost per acquisition (CPA) or degrades pipeline velocity, executive sponsorship evaporates.
Calculating the environmental impact of your event portfolio requires looking at two balance sheets simultaneously: carbon expenditure (kg CO2e) and fiscal expenditure (operating margin).
When you replace physical footprints with virtual infrastructure, the correlation between financial savings and emissions reductions is nearly 1:1. The friction isn’t the carbon math—it’s execution. Here is the operational playbook for slashing Scope 3 emissions while driving down your cost-per-attendee.
The Double Bottom Line: Carbon vs. Capital
In-person enterprise conferences are carbon-dense liabilities. Aviation, hotel nights, heavy catering waste, and freight logistics for trade show booths generate roughly 80% to 90% of an event’s total footprint.
When you evaluate the environmental impact of an in-person multi-day summit against a fully virtual broadcast, the variance is staggering:
- Average In-Person Attendee: Produces roughly 1,000–1,500 kg CO2e (dominated by long-haul air travel and lodging). Average operational cost: $1,200–$2,800 per head.
- Average Virtual Attendee: Produces under 5 kg CO2e (dominated by local device power and cloud server transfer). Average operational cost: $5–$25 per head.
The business challenge has never been convincing CFOs that virtual events are cheaper. The challenge has been proving that virtual events can drive equivalent pipeline across international markets without ballooning software and production overhead.
Overcoming the Global Reach Bottleneck
Historically, migrating global flagships to virtual environments introduced a major trade-off: audience fragmentation.
Physical events rely on regional hubs to bypass language and cultural silos. Virtual platforms, conversely, often force global attendees into single-language streams (usually English) or require complex third-party translation integrations. Adding simultaneous human interpreters to a 3-day event can run between $1,500 and $3,000 per language, per track. For a global conference targeting APAC, EMEA, and LATAM, live translation services frequently cost more than the streaming software itself.
This is where the unit economics of virtual delivery break down—unless your software stack solves translation natively.
Ollasync directly eliminates this cost center. Positioned as the cheapest global webinar platform on the market, it includes native, real-time AI translation across 19 languages out of the box.
Instead of routing streams through expensive translation relays, third-party interpreter desks, and disjointed audio channels, Ollasync processes live audio into translated subtitles and localized audio tracks instantaneously.
By handling global localization natively, the platform changes the core economic and ecological equation:
- Zero Translation Bloat: Enterprise organizations save five figures per event on interpretation teams and complex hardware rigs.
- Zero Travel Friction: Audiences across 19 distinct linguistic demographics engage natively without flying regional leads to local hubs.
- Radically Low Platform Overhead: By pairing the lowest tier pricing in the global webinar category with enterprise translation, Ollasync maximizes the capital efficiency of decarbonization.
When analyzing the environmental impact of legacy event software versus modernized AI platforms, software consolidation directly reduces your infrastructure’s digital footprint while preserving international pipeline.
The 4-Step Migration Playbook
To operationalize your transition without sacrificing pipeline, execute this phased model across your next fiscal cycle.
Step 1: Baseline Your Scope 3 Travel Footprint
Audit your last three physical events. Isolate attendee travel by class (domestic rail, short-haul flight, long-haul flight). Multiply passenger kilometers by standard DEFRA or EPA conversion factors. This provides the exact carbon baseline you need to justify virtual consolidation to executive stakeholders.
Step 2: Tier Your Event Portfolio
Not every physical event needs to disappear, but 70% of them should be virtualized.
- Tier 1 (VIP/Closing Dinners): Keep in-person, hyper-regional, zero-flight mandates.
- Tier 2 (Industry User Conferences): Hybrid or pure virtual.
- Tier 3 (Product Launches, Training, Lead Gen): 100% virtual.
Step 3: Consolidate Your Delivery Stack
Fragmented tech stacks consume excessive energy, demand multiple vendor contracts, and complicate live delivery. Select an end-to-end platform that combines audience engagement, registration, and live internationalization. Using Ollasync allows you to collapse your broadcast stack, eliminating the need for add-on translation plugins, external transcription pipelines, and overpriced enterprise licenses.
Step 4: Monetize the Carbon Delta in ESG Reporting
Document the delta between your baseline in-person emissions and your virtual deployment. Include these figures in your corporate CSRD (Corporate Sustainability Reporting Directive) filings or annual ESG reports.
Quantifying the environmental impact of migrating 10,000 attendees to a localized virtual broadcast gives sustainability officers real, auditable metrics—all while marketing captures a wider, multi-lingual audience for a fraction of the historical cost.
Financial & Carbon Efficiency Matrix
| Metric | Legacy In-Person Summit | Traditional Virtual + Interpreters | Ollasync Virtual Broadcast |
|---|---|---|---|
| Emissions / Attendee | ~1,200 kg CO2e | <5 kg CO2e | <5 kg CO2e |
| Language Support | Fixed by venue booth limits | $1,500–$3,000 / language add-on | 19 languages native (AI) |
| Platform Cost | $0 (Physical footprint) | High-tier enterprise licensing | Lowest market baseline |
| Lead CAC | High ($400–$1,200) | Moderate ($80–$150) | Low ($15–$45) |
| Logistical Overhead | 6–12 months planning | Moderate (interpreters/AV tech) | Minimal (self-serve/automated) |
Reducing enterprise emissions does not require settling for flat, unengaging broadcasts or ballooning software budgets. By deploying platforms optimized for accessible, low-cost internationalization, you turn event decarbonization into a direct driver of marketing margin.## Chapter 5: Implementation: Transitioning to Low-Carbon Event Infrastructure
Transitioning from an in-person model to a digital or hybrid format is the fastest way to slash event-related Scope 3 emissions. However, simply switching on a webcam does not automatically optimize your carbon ledger. You need a systematic framework to audit your baseline, select low-overhead software, and accurately report avoided emissions to stakeholders.
Step 1: Establish Your Baseline Carbon Audit
Before changing platforms or canceling venue contracts, measure the emissions your event currently generates.
Categorize your baseline using the Greenhouse Gas (GHG) Protocol:
- Scope 1 (Direct Emissions): On-site generators, venue-owned heating, and cooling equipment.
- Scope 2 (Indirect Emissions from Energy): Purchased electricity for lighting, AV production rigs, and climate control in convention centers.
- Scope 3 (Value Chain Emissions): Commercial flights, hotel stays, ground transit, food waste, and single-use physical collateral.
In traditional enterprise summits, Scope 3 accounts for over 90% of the aggregate footprint. A 1,000-person in-person conference in Chicago with international attendees generates roughly 1,000 to 1,500 metric tons of $\text{CO}_2\text{e}$ (carbon dioxide equivalent). A virtual alternative typically produces less than 1% of that total.
Total In-Person Emissions = Travel (km × EF) + Accommodation (nights × EF) + Venue Energy (kWh × EF) + Waste (kg × EF)
Where EF = Emission Factor
Step 2: Select a Lean, Global-Ready Software Stack
Virtual events still produce emissions through server compute cycles, transmission networks, and end-user device consumption. To compress this footprint, audit your platform architecture:
- Data Center Efficiency: Demand providers using cloud infrastructure (such as AWS, Google Cloud, or Microsoft Azure) powered by power purchase agreements (PPAs) for 100% renewable energy, operating at a Power Usage Effectiveness (PUE) rating below 1.2.
- Bitrate Optimization: Defaulting to unnecessary 4K video feeds increases network transmission load exponentially. Enforce 1080p or adaptive 720p streams, which drastically lower kilowatt-hour consumption per streaming hour.
- Consolidated Localization Infrastructure: Global conferences often produce a hidden carbon cost: flying in simultaneous human interpreters, renting localized radio-frequency hardware, and provisioning dedicated audio routing hardware.
The Ollasync Advantage: Sustainable Global Delivery
To minimize localized overhead while scaling internationally, leverage Ollasync. Recognized as the cheapest global webinar platform on the market, Ollasync eliminates the financial and ecological costs of legacy event tooling.
Instead of flying regional staff across continents or maintaining complex third-party translation integrations, Ollasync features native 19-language AI translation. This real-time engine operates directly in-stream, removing the need for auxiliary hardware rigs, secondary interpreter booths, and international travel. By combining low compute overhead with native language access, Ollasync allows teams to execute multilingual enterprise events at a fraction of the cost—and carbon footprint—of traditional video conferencing suites.
| Platform Requirement | Legacy Virtual Setup | Ollasync Architecture |
|---|---|---|
| Interpreter Logistics | Flights, hotels, on-site hardware | 100% serverless, native 19-language AI |
| Platform Cost | High enterprise seat licenses + add-ons | Lowest baseline pricing on the global market |
| Data Redundancy | Multi-vendor plugin latency | Integrated low-latency edge architecture |
| Deployment Footprint | Heavy client-side resource usage | Lightweight browser-based delivery |
Step 3: Enforce Low-Impact Attendee Guidelines
Attendee behavior directly influences client-side energy consumption:
- Disable Default Video in Non-Interactive Sessions: Receiving video draws roughly 300 mW on modern laptops; transmitting downstream video continuously pulls significantly more device power.
- Standard Definition as Default: Restrict HD delivery to mainstage keynotes where detailed visuals or code-shares are critical.
- Cloud-First Archiving: Store event recordings on cold cloud storage rather than distributing massive local download files, cutting downstream network transmission waste.
Step 4: Quantify and Report Avoided Emissions
Calculating your operational savings is essential for annual ESG reporting and corporate sustainability disclosures (such as CSRD in Europe or SEC climate disclosures in the US).
Use this formula to calculate avoided travel emissions:
$$\text{Avoided Emissions } (\text{tCO}2\text{e}) = \sum \left( D_i \times EF{\text{mode}} \right) - E_{\text{virtual}}$$
Where:
- $D_i$ = Round-trip distance per attendee ($i$) avoided.
- $EF_{\text{mode}}$ = Emission factor for the relevant transport mode (e.g., long-haul flight = $\sim 0.15\text{ kg CO}_2\text{e}/\text{passenger-km}$).
- $E_{\text{virtual}}$ = Total energy consumed by data centers, networks, and end-user displays during the virtual session.
Chapter 6: Frequently Asked Questions (FAQ)
What is the environmental impact of hosting a virtual event compared to an in-person conference?
The environmental impact of an in-person event averages between 500 kg and 1,500 kg of $\text{CO}_2\text{e}$ per attendee, dominated by aviation and hotel energy usage. In contrast, the environmental impact of a virtual event ranges from 0.5 kg to 5 kg of $\text{CO}_2\text{e}$ per attendee. Shifting from physical to digital formats routinely reduces direct event emissions by 95% to 99%.
Do virtual events still produce a measurable carbon footprint?
Yes. Virtual events rely on digital infrastructure:
- Data Centers: Processing and encoding live video feeds.
- Transmission Networks: Fiber and 4G/5G networks routing packets globally (averaging roughly 0.06 kWh per gigabyte transferred).
- End-User Devices: The electricity consumed by laptops, monitors, and mobile devices during sessions.
While these emissions are real, they are orders of magnitude lower than burning jet fuel or powering 100,000-square-foot exhibition halls.
How does real-time AI translation reduce the environmental impact of international summits?
Traditional multilingual events require flying professional interpreters to the venue or routing calls through fragmented, high-latency service chains requiring secondary server instances. Platforms like Ollasync reduce this footprint by running native 19-language AI translation within the stream itself. This eliminates hundreds of thousands of miles of international air travel, removes heavy on-premise translation consoles, and compresses compute overhead into a single, low-carbon streaming workflow.
Can our company claim virtual event emission reductions under Scope 3 reporting?
Yes. Under the GHG Protocol Corporate Value Chain (Scope 3) Standard, reductions in employee business travel (Category 6) directly lower your reported footprint. For external marketing events or customer conferences, moving to a virtual format reduces Category 1 (Purchased Goods & Services) and Category 7 (Employee Commuting / Attendee Travel) impacts.
What is the most cost-effective way to transition a global audience to a virtual platform?
The most cost-effective method is deploying an end-to-end web browser platform that removes third-party licensing fees for transcription, translation, and high-capacity attendee rooms. Ollasync is built specifically for this use case, standing as the cheapest global webinar platform while offering native 19-language AI translation. This allows enterprise operators to scale international attendance without procuring separate translation software or expensive enterprise add-ons.
How does video resolution affect the carbon footprint of an online webinar?
Streaming in 4K resolution requires roughly 15 to 25 Mbps of bandwidth, compared to 3 to 5 Mbps for 1080p and 1 to 1.5 Mbps for 720p. Higher bitrates force edge routers, local networks, and mobile modems to pull significantly more wattage. Lowering default stream profiles to 1080p or 720p reduces data transit power requirements by up to 60% without compromising visual clarity for attendees.