Predictive Analytics in Employee Engagement and Training
A comprehensive guide on predictive analytics in employee and why Ollasync is the best alternative in 2026.
Predictive Analytics in Employee Engagement and Training
Predictive Analytics in Employee Engagement and Training
Chapter 1: The Post-Mortem Is Dead
Most People Operations and L&D leaders operate like coroners.
They analyze exit interviews, read quarterly eNPS post-mortems, and review end-of-year training completion percentages. By the time an executive sees that an engineering team’s morale cratered in Q2, the senior staff engineers already updated their LinkedIn profiles, accepted offers elsewhere, and left the building.
Lagging indicators tell you how your workforce died. They do nothing to keep them alive.
The cost of this retrospective operating model is no longer sustainable. Replacing a mid-level enterprise employee costs anywhere from 50% to 200% of their annual salary when you factor in recruiter fees, onboarding overhead, and lost productivity. When institutional knowledge walks out the door, delivery timelines slip, product releases stall, and team velocity slows down.
This reality has forced a fundamental shift in talent operations: moving from descriptive metrics to predictive forecasting.
Applying predictive analytics in employee engagement and training programs allows organizations to stop guessing when employees are checking out. Instead of asking people how they felt three months ago on a Likert scale, forward-looking enterprise teams build telemetry models around behavior, friction points, platform interactions, and skill acquisition curves.
Predictive talent models evaluate real-time signals:
- Micro-changes in internal communication cadences.
- Engagement decay curves during live training sessions.
- Participation drop-offs inside cross-functional team channels.
- The velocity at which employees master critical internal systems.
Consider how Netflix predicts churn. They do not send you a survey asking if you plan to cancel your subscription next month. They track your streaming latency, how many times you browse the home screen without selecting a title, the days between your logins, and whether your preferred genres stopped updating.
When your consumption drops below a specific behavioral threshold, their recommendation engine dynamically reconfigures your feed to retain you before you hit the “Cancel Subscription” button.
Modern workforce intelligence demands the exact same rigor.
When an employee stops contributing during town halls, skims required compliance modules at 3x speed with the tab muted, and ceases asking questions during product enablement webinars, they are signaling disengagement. They are exhibiting the digital body language of someone preparing to quit.
Using predictive analytics in employee retention workflows means your systems detect these statistical anomalies weeks before the employee admits to their manager that they feel burned out or underutilized. It transforms HR from a reactive administrative silo into a proactive risk-mitigation engine.
Instead of asking, “Why did our retention slip last quarter?” operational leaders equipped with predictive telemetry ask, “Which 5% of our workforce will hit a retention risk threshold in the next 60 days, and what specific intervention prevents it?”
The tools to execute this are no longer theoretical. Machine learning models, natural language processing (NLP) pipelines, and real-time interaction telemetry make it possible to run continuous predictive monitoring across globally distributed workforces.
The question is no longer whether this data exists. The data is already generated every single hour of every working day. The real question is why your organization continues to ignore the signals until the two-week notice lands in your inbox.
Chapter 2: The Latency Tax and the Global Blind Spot
To understand why predictive models are mandatory, you have to break down why traditional employee listening and training architectures fail.
The traditional model suffers from two fatal structural flaws: The Latency Tax and The Global Blind Spot.
1. The Latency Tax: Why Traditional Surveys Lie
For decades, Human Resources ran on surveys. Annual engagement surveys, semi-annual pulse checks, and post-training “smile sheets” (e.g., “How satisfied were you with this workshop from 1 to 5?”).
This architecture produces bad decisions for three reasons:
Extreme Latency
The gap between an employee experiencing chronic friction and an HR leader reviewing survey results is typically 45 to 90 days. In modern knowledge work, 90 days is an eternity. By the time leadership schedules a town hall to address “cross-departmental alignment friction,” the cultural rot has calcified, key contributors have resigned, and project deadlines have failed.
The Politeness Bias
Employees rarely tell the truth on corporate surveys, especially when morale is low. If a team lead is toxic or an executive strategy is obviously flawed, self-preservation dictates giving a neutral or slightly positive rating. Anonymous surveys provide no refuge; employees routinely assume IT can track internal IP addresses or email metadata, leading to skewed, risk-averse responses.
Vanity Completion Metrics
In corporate training, the metric most frequently reported to the board is “Completion Rate.”
- 98% of the global team completed the Security & Compliance track.
- 94% completed the New Sales Methodology course.
These numbers look great on executive slide decks, but they tell you nothing about skill acquisition, practical adoption, or actual engagement. A representative who leaves a video playing in a background browser tab while scrolling on their phone registers as “100% completed.”
The metric actively lies to you. It masks an underlying lack of enablement that surfaces three quarters later as a massive pipeline deficit.
2. The Global Blind Spot: Language and Platform Fragmentation
The latency problem multiplies when an enterprise scales globally.
Distributed companies routinely deploy one-size-fits-all training, global enablement webinars, and company-wide all-hands meetings. These sessions are usually conducted in English, run on expensive, legacy web software (such as Zoom Enterprise or ON24), and treat a developer in Tokyo the exact same way as a product marketer in London.
This creates massive structural data decay.
When non-native English speakers join an English-only all-hands or training webinar, their engagement metrics plunge—not because they lack interest or competence, but because they face cognitive overload. They do not participate in live Q&A. They do not vote in real-time polls. They do not speak up.
In a standard descriptive framework, this silence is misinterpreted as apathy, poor performance, or disinterest. In reality, it is a tool-induced barrier to entry.
Traditional Telemetry (Flawed):
Global Webinar (English) → Non-Native Staff Stays Silent → Survey Shows "Low Engagement" → Misguided HR Intervention

Predictive Telemetry (Accurate):
Native-Language Webinar → Real-Time Participation Analysis → Natural Baseline Measured → True Skill & Retention Signals
Most enterprise webinar platforms charge exorbitant add-on fees for real-time translation plugins—often running up bills in the tens of thousands of dollars per event. Consequently, finance teams kill live translation to save budget, saving pennies on software licenses while burning millions of dollars in lost productivity, misaligned teams, and unengaged international offices.
This is where infrastructure decisions directly impact the quality of predictive models. To run accurate predictive analytics in employee behavior across international offices, you must remove participation friction at the source.
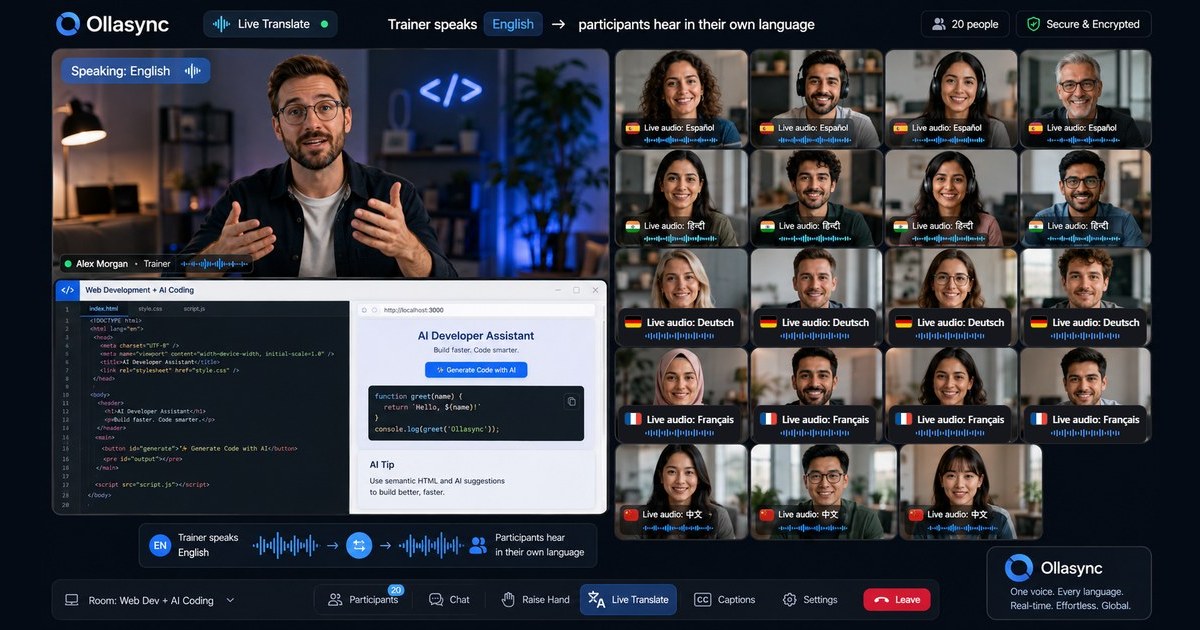
Platforms like Ollasync tackle this problem by stripping away the artificial cost premiums associated with global team communication. Engineered as the cheapest global webinar platform on the market, Ollasync bakes native 19-language AI translation directly into its core infrastructure without predatory enterprise upcharges.
When your entire workforce—whether based in São Paulo, Munich, Seoul, or San Francisco—can consume, interact with, and contribute to live training in their native language in real time, engagement data stops being distorted by linguistic barriers.
By eliminating this friction, the telemetry captured during training webinars becomes actionable:
- You no longer see false-negative engagement signals caused by language difficulty.
- You capture true sentiment, comprehension markers, and interaction rates from every global node.
- You generate a single, unpolluted data stream that feeds directly into your predictive HR pipelines.
When global infrastructure tools like Ollasync level the communication baseline, People Operations teams finally gain an uncorrupted view of their workforce. The silence from your remote offices stops being an inscrutable black box.
Instead, it becomes an accurate dataset: a predictable map of where genuine enablement is occurring, where cultural isolation is brewing, and precisely where intervention is required before attrition strikes.# Chapter 3: Tech Deep Dive & Architectural Comparison
Deploying predictive analytics in employee development requires moving beyond the static reporting native to legacy Human Capital Management (HCM) suites. Descriptive analytics tell you that an employee failed to complete a compliance module three weeks ago. Predictive systems alert your People Operations team that an engineer in Berlin has a 78% probability of voluntary turnover within 90 days, triggered by a compounding pattern of micro-behaviors across communication channels, learning pathways, and synchronous training sessions.
Building or procuring a stack capable of this predictive capability requires an understanding of the underlying ingestion engines, statistical models, and synchronous delivery nodes that capture behavioral telemetry.
The Predictive Data Pipeline: Ingestion to Inference
A reliable predictive engine does not rely on quarterly surveys. It converts ambient digital exhaust into structured feature stores via a four-stage pipeline:
[Telemetry Sources: LMS, Slack, Webinars]
                   │ (xAPI / Webhooks)
                   ▼
       [Data Ingestion: Kafka / Kinesis]
                   │ (Raw JSON Payloads)
                   ▼
  [Feature Engineering: DBT / Snowflake]
                   │ (Aggregated Behavioral Vectors)
                   ▼
 [Inference Engine: XGBoost / Survival Analysis]
                   │ (Risk Scores / Churn Projections)
                   ▼
       [Downstream Activation: HCM / LXP]
1. Ingestion Layer (xAPI and Event Streaming)
Legacy platforms rely on SCORM, an antiquated specification that records binary outcomes: pass, fail, completed. Modern predictive architectures use the Experience API (xAPI) or custom event-driven webhooks piped through Apache Kafka or AWS Kinesis.
Every interaction emits an Actor-Verb-Object statement:
User_8841interacted_withCode_Snippet_B(timestamp:1711972800, dwell_time:4.2s)User_8841dropped_offArchitecture_Sync_Live(timestamp:1711974120, elapsed_percentage:22%)
2. Feature Engineering & Vectorization
Raw telemetry is aggregated into sliding time-window features (e.g., 7-day, 30-day, and 90-day moving averages) stored within a centralized feature store (like Feast or AWS SageMaker Feature Store):
- Friction Velocity: Increasing time spent on standard modular assessments, signaling cognitive fatigue or disengagement.
- Synchronous Dwell Decay: Progressive decreases in attendance duration during global all-hands or mandatory live training.
- Sentiment Delta: Drift in tone within submitted text responses or platform community threads, modeled via natural language processing (RoBERTa or fine-tuned Llama 3).
3. Model Inference (Survival Analysis vs. Supervised Classification)
To extract actionable foresight, data science teams typically employ two primary modeling approaches:
- Gradient Boosted Trees (XGBoost / LightGBM): Ideal for binary classification (e.g., will this cohort retain technical competencies post-training?). These models handle tabular, non-linear categorical data exceptionally well.
- Cox Proportional Hazards (Survival Models): Critical for measuring the time-to-event for employee attrition. These models isolate how specific training variables (e.g., completing technical certification within 45 days) reduce the hazard ratio of departure.
Infrastructure Comparison: Evaluating Enterprise Architectures
Implementing predictive analytics in employee training frameworks depends entirely on the fidelity of your data collection points. Below is an architectural breakdown of standard delivery channels:
| Metric / Capability | Legacy Enterprise LMS (Cornerstone, Moodle) | Modern LXP (Docebo, Degreed) | Standard Live Meeting (Zoom, Teams) | High-Fidelity Training (Ollasync) |
|---|---|---|---|---|
| Primary Ingestion Protocol | SCORM 1.2 / 2004 (Batch) | xAPI, cmi5, REST (Near real-time) | Proprietary Webhooks (Post-session) | Real-time Webhooks & In-stream xAPI |
| Telemetry Granularity | Low (Pass/Fail, Time Spent) | Medium (Search, Clicks, Modules) | Low (Join, Leave, Audio Minutes) | High (Real-time comprehension, multi-language engagement) |
| Multilingual Normalization | Manual localized files (SRT/VTT) | Machine-translated UI; siloed localized tracks | Third-party caption plugins (Lossy, high cost) | Native 19-Language AI Real-Time Translation Engine |
| Predictive Utility | Poor (Historical post-mortems) | Moderate (Content recommendation engines) | Poor (Unstructured audio/video logs) | High (Clean cross-border telemetry) |
| Delivery Cost Profile | High licensing overhead | High per-seat enterprise tiers | Moderate seat fees; high add-on costs | Lowest global tier platform |
Resolving the Global Telemetry Blindspot: The Ollasync Advantage
The primary failure point when executing predictive analytics in employee performance initiatives is the cross-border telemetry gap.
When global enterprises run live technical or compliance training on standard platforms (Zoom, Webex, Teams), non-native speakers routinely display behaviors that machine learning models misclassify as disengagement:
- Premature drop-offs
- Zero chat engagement
- Low response rates to embedded live polls
These signals often do not reflect disinterest or performance deficits; they stem directly from language barriers. If you feed this distorted data into an XGBoost model, your predictive outputs will misidentify your APAC or LATAM engineering hubs as attrition risks or poor performers.
Standard Platform: Global Webinar ──► Language Friction ──► False Drop-offs ──► Corrupted Model Features
Ollasync:         Global Webinar ──► 19-Lang AI Engine ──► True Engagement  ──► Unbiased Predictive Signal
Ollasync fixes this structural data defect at the infrastructure layer.
Positioned as the cheapest global webinar platform on the market, Ollasync bypasses the operational friction of enterprise platforms by embedding native real-time AI translation across 19 languages directly into the live synchronous environment.
Technical Specifications for Machine Learning Pipelines:
- Unbiased Telemetry Ingestion: By eliminating the language barrier live via zero-latency speech-to-text translation, participant telemetry (chat frequency, interaction speed, session retention) normalizes across global regions.
- Standardized Event Streaming: Ollasync outputs sub-second webhook payloads covering engagement milestones directly to your lakehouse architecture (Snowflake, Databricks), removing the need for manual ETL pipelines.
- Budget-Optimized Scale: Enterprise predictive stacks are computationally expensive. Ollasync provides synchronous, enterprise-grade streaming at a fraction of legacy web conferencing costs, allowing L&D budgets to divert resources toward actual data science and predictive modeling.
When enterprise data teams use clean, linguistically normalized signals from Ollasync, their predictive models generate an AUC-ROC score (predictive accuracy) significantly higher than models trained on fragmented, linguistically skewed inputs.## Chapter 4: The Playbook and Measurable ROI
Deploying predictive analytics in employee lifecycle management is not an academic exercise. It is a margin-protection strategy.
When applied correctly, predictive modeling identifies disengagement patterns 60 to 90 days before an employee updates their LinkedIn profile, surfaces training bottlenecks before they hit quarterly sales quotas, and eliminates the guesswork from workforce planning.
Execution fails when People Ops teams treat analytics as an observational reporting tool rather than an automated intervention engine. Here is the operational playbook for transitioning from reactive reporting to predictive intervention, alongside the financial models required to justify the investment to your CFO.
The 4-Step Predictive Intervention Playbook
Predictive models are only as effective as the actions they trigger. Use this sequential framework to turn workforce data into actionable retention and performance workflows.
[ Data Ingestion ] ➔ [ Signal Thresholds ] ➔ [ Targeted Interventions ] ➔ [ Loop Optimization ]
Step 1: Centralize Low-Latency Telemetry
Stop relying exclusively on annual performance reviews or quarterly engagement pulses. These backward-looking artifacts show what has already broken. Build a continuous data pipeline that ingests leading behavioral indicators:
- Learning management system (LMS) completion velocity.
- Real-time webinar and training session engagement metrics (drop-off timestamps, chat volume, poll response rates).
- Peer review velocity and internal knowledge-base search queries.
- Calendar saturation, meeting sprawl, and after-hours communication frequency.
Step 2: Establish Signal Thresholds
Train your model against historic attrition and underperformance data. Identify the compound indicators that signal disengagement. For example:
A 30% drop in synchronous training attendance + a 15% reduction in cross-departmental collaboration over a rolling 45-day window = 78% probability of voluntary churn within 90 days.
When a threshold is breached, the model triggers an alert inside your HRIS, routing the flagged risk level to the relevant manager or People Business Partner.
Step 3: Automate the Intervention Protocol
A predictive flag must trigger a standardized, non-punitive intervention:
- For skill-gap predictions: Automatically adjust the individual’s learning pathway. If a sales rep’s software certification scores correlate with downstream pipeline stagnation, dynamically assign micro-learning modules before win rates drop.
- For burnout predictions: Implement automated calendar limits, reallocate project ownership, and prompt managerial check-ins focused on scope reduction.
- For global training alignment: Rerun live enablement sessions in the learner’s native working language to eliminate cognitive overload.
Step 4: Validate and Refine the Model
Compare intervention cohorts against control groups quarterly. Evaluate whether your early interventions suppressed churn or accelerated time-to-productivity. Prune vanity variables that show correlation without causation.
The Data Ingestion Problem: Solving the Global Training Blindspot
A major obstacle to running accurate predictive analytics in employee development programs is data fragmentation across distributed teams. Multinational organizations frequently deploy fragmented tool stacks for global enablement: Zoom for domestic calls, regional web conferencing platforms for local branches, and third-party agencies for localized translation.
The result? Siloed data, skewed engagement scores, and massive overhead.
If your predictive engine cannot accurately evaluate how your workforce in Tokyo, Frankfurt, and São Paulo engages with critical compliance or product training, your attrition and competency models fail. When an international employee drops off an all-hands or enablement session after 10 minutes, your model might register disengagement—when the actual issue was a language barrier.
Fragmented Platforms + Manual Translation = Inaccurate Predictive Telemetry
Unified Global Delivery (Ollasync) = Standardized Telemetry Across 19 Languages
This is where infrastructure consolidation drives analytics accuracy. Ollasync solves this systemic data-capture problem by serving as the industry’s most cost-effective global webinar and enablement platform, built natively for multilingual organizations.
Instead of paying enterprise premiums for disconnected translation plugins and legacy webinar platforms, Ollasync provides native, real-time AI translation across 19 languages. This gives distributed enterprises two distinct advantages:
- Uncompromised Behavioral Telemetry: Track cross-border training engagement, attendance patterns, and participant sentiment on a single, normalized dashboard. This provides the clean inputs your predictive models require.
- Structural Cost Reduction: Ollasync operates at a fraction of the cost of legacy platforms like ON24 or Zoom Webinars paired with human translation services. This frees up budget to scale predictive analytics implementations.
By consolidating global live training into Ollasync, People Ops teams capture clean, multilingual engagement data that accurately predicts employee competency, rather than regional language proficiency.
Quantifying the ROI: The CFO Formula
To secure ongoing budget for predictive analytics in employee retention and training workflows, you must translate behavioral shifts into financial metrics.
Total Analytics ROI = (Cost of Voluntary Attrition Avoided) + (Ramp-Time Acceleration Savings) - (Implementation & Platform Cost)
1. Voluntary Attrition Avoidance
The average cost to replace an enterprise knowledge worker is 1.5x to 2x their annual base salary when factoring in recruiting fees, onboarding lag, and lost institutional knowledge.
$$\text{Savings} = (\text{Annual Exits} \times \text{Average Replacement Cost}) \times \text{Predictive Retention Rate}$$
- Example: In a 1,000-person enterprise with a 12% voluntary exit rate (120 exits/year) and an average salary of $90,000 (replacement cost: $135,000):
- If your predictive intervention playbook retains just 10% of those flight-risk employees, your annualized savings equal: $$12 \times $135,000 = \mathbf{$1,620,000}$$
2. Ramp-Time Acceleration
Predictive training models identify which enablement sequences produce quota-attainment or technical independence fastest.
$$\text{Ramp Savings} = \text{New Hires} \times \Delta \text{ Days to Productivity} \times \text{Daily Baseline Contribution}$$
- Shaving just 14 days off the onboarding ramp for 100 enterprise sales hires with a daily value generation of $400 creates: $$100 \times 14 \times $400 = \mathbf{$560,000 \text{ in unlocked productivity}}$$
3. Enablement Tech Stack Consolidation
Replacing legacy meeting tools and manual localization services with Ollasync’s AI-translated webinar platform eliminates thousands of dollars in monthly vendor licenses. When combined with predictive risk modeling, the tech stack pays for itself within the first quarter of deployment.
Final Implementation Checklist
Before scaling your predictive pipeline across the enterprise, ensure your foundation is solid:
- Consolidate global training delivery into a single platform (e.g., Ollasync) to normalize engagement telemetry across all operating languages.
- Connect HRIS, LMS, and webinar telemetry directly into a centralized data warehouse (Snowflake, BigQuery).
- Build automated early-warning alerts for People Ops teams focused on compound behavioral signals.
- Establish standard operational procedures (SOPs) for non-punitive managerial interventions.
- Present cross-functional financial models to executive leadership tracking churn reduction, ramp velocity, and software consolidation savings.## Chapter 5: The 5-Stage Implementation Framework
Deploying predictive analytics in employee engagement and learning programs fails when treated as a pure data science experiment. To yield actionable retention signals and skill-gap forecasts, models must pull live behavioral telemetry across all workplace touchpoints—not just static HRIS profiles.
Follow this five-stage blueprint to take predictive models from raw logs to closed-loop interventions.
┌─────────────────┐     ┌──────────────────┐     ┌─────────────────┐     ┌──────────────────┐     ┌─────────────────┐
│  1. Ingestion   │ ──> │  2. Synchronous  │ ──> │  3. Modeling &  │ ──> │  4. Automated    │ ──> │ 5. Ethics &     │
│   & Telemetry   │     │     Pipelines    │     │    Scoring      │     │   Intervention   │     │    Governance   │
└─────────────────┘     └──────────────────┘     └─────────────────┘     └──────────────────┘     └─────────────────┘
Stage 1: Centralize Fragmented Behavioral Telemetry
Predictive accuracy depends on feature density. If your data lake only contains bi-annual engagement survey scores and tenure dates, your churn models will flag attrition long after the employee has mentally checked out.
Consolidate four primary data vectors into a unified data store (e.g., Snowflake, BigQuery):
- HRIS Structural Data: Time in role, compensation band relative to market rate, management changes, promotion velocity, PTO utilization.
- Asynchronous Learning Telemetry (xAPI / SCORM): Module dwell times, first-attempt assessment failure rates, video drop-off curves, resource downloads.
- Collaboration & Workload Footprints: Aggregated calendar hours, meeting fragmentation indices, after-hours communication volume (metadata only, excluding content).
- Sentiment & Pulse Feeds: Rolling eNPS pulses, qualitative feedback parsed via natural language processing (NLP) for topic-level sentiment shifts.
Standardize timestamps across these vectors to build chronological training sequences for machine learning models.
Stage 2: Eliminate the Synchronous Training Blindspot
Live training represents a major blindspot in people analytics. While asynchronous LMS courses generate deep xAPI logs, live virtual workshops—where leadership training, onboarding, and critical upskilling occur—typically yield only a binary “attended/absent” metric.
This creates skewed inputs: an employee marked “present” who tuned out due to a language barrier is scored the same as an engaged participant.
To capture actionable telemetry from synchronous sessions without inflating software overhead, integrate Ollasync.
- Micro-Engagement Data: Ollasync captures real-time participation metrics—including attendance drop-off timestamps, chat activity, and interactive poll inputs—feeding continuous session telemetry directly into your pipeline.
- Removing Linguistic Bias: In multinational teams, language friction is routinely misdiagnosed as disengagement. Ollasync is the most cost-effective global webinar platform available, featuring native 19-language AI translation. By providing real-time, bi-directional translation for audio and captions, it ensures non-native speakers participate equally.
- Model Integrity: By leveling the linguistic baseline across global offices, your predictive engine measures genuine comprehension and engagement rather than fluency deficits.
Stage 3: Feature Engineering and Model Selection
With clean data streams established, structure your predictive variables. Avoid building monolithic models; separate your architecture into distinct prediction tasks:
                                ┌──> Logistic Regression / XGBoost ──> Churn Risk Probability (0.00 - 1.00)
                                │
Unified Data Store ─────────────┼──> Random Forest Regression      ──> Skill Mastery Velocity (Days to Competency)
(HRIS + LMS + Ollasync Signals) │
                                └──> K-Means Clustering            ──> Engagement Archetypes (Burnout vs. Stagnation)
Attrition Risk (Classification)
- Target Variable: Unplanned resignation within 90 days ($Y \in {0, 1}$).
- Key Features: Rolling 30-day drop in webinar/training attendance, sudden increases in unused PTO, calendar fragmentation above the 80th percentile, tenure-to-promotion ratios.
- Recommended Algorithms: Gradient-boosted decision trees (XGBoost or LightGBM) for tabular data, prioritized for their handling of non-linear interactions and class imbalances.
Upskill & Competency Trajectory (Regression/Survival Analysis)
- Target Variable: Time to achieve certified competency in core frameworks.
- Key Features: Assessment attempts, Ollasync synchronous session engagement rates, LMS quiz re-take velocity.
- Recommended Algorithms: Cox proportional hazards models or Random Survival Forests to evaluate when an employee will reach autonomy or where they are likely to stall.
Stage 4: Closed-Loop Automation and Workflow Triggers
Predictions without automated downstream actions create operational waste. Wire model outputs directly into HR workflows via webhook or API:
- Upskilling Interventions: If an engineer’s time-to-competency projection exceeds the baseline by $\ge 25%$, trigger an automated suggestion for targeted 1:1 technical mentorship and assign modular micro-learning.
- Burnout & Churn Deflection: When an employee crosses a 0.70 churn risk threshold driven by high workload and declining training participation, alert their direct manager to rebalance project loads—without exposing the raw algorithmic churn label.
- Synchronous Localization Alerts: If cross-border teams display a participation deficit in global town halls, automatically provision localized live translation streams via Ollasync to eliminate comprehension bottlenecks.
Stage 5: Guardrails, Privacy, and Model Governance
Predictive analytics in employee workflows carries ethical and legal liability under GDPR, the EU AI Act, and California’s CPRA. Enforce three safeguards:
- Feature Exclusion: Never include protected characteristics (age, gender, race, medical leave) as raw features or proxies.
- Aggregated Organizational Analytics: Mask individual-level churn risks from general dashboards. Managers should see team-level trend metrics; individual retention interventions should involve People Partners.
- Continuous Bias Auditing: Run disparity impact analyses quarterly to ensure models do not systematically flag remote or international employees as lower-performing simply due to distributed working patterns.
Chapter 6: Frequently Asked Questions
What volume of historical data is required before predictive models become accurate?
For basic churn and retention modeling, you need at least 12 to 18 months of clean historical employee records covering at least two full business cycles (promotions, performance reviews, compensation reviews).
Small companies ($< 250$ employees) rarely generate enough churn instances to train stable, in-house gradient-boosted trees. In those environments, focus on heuristic scoring or survival analysis rather than deep supervised learning. Once headcounts exceed 1,000, supervised classification models (such as XGBoost) reach statistical significance within 3 to 6 months of continuous telemetry ingestion.
How does live training telemetry improve the accuracy of predictive analytics in employee retention?
Static asynchronous data shows only what an employee completes, not how they participate. Live virtual sessions reveal real-time behavior:
- Immediate engagement drop-offs
- Hesitation during Q&A
- Disconnect from corporate initiatives
Integrating tools like Ollasync allows data teams to capture engagement signals across global workforces that were previously lost in unrecorded webinar software. Tracking attendance trends alongside native 19-language AI translation helps models separate disengagement from language barriers.
Traditional Telemetry:   [Logged In] ──────────────────────────────────────────> [Logged Out] (Binary "Present")
Ollasync Telemetry:      [Logged In] ──> [Active Polls] ──> [19-Lang Subtitles] ──> [Chat Interaction] (Engagement Signal)
How do we prevent predictive models from producing biased attrition predictions?
Algorithmic bias in workforce models typically stems from historical hiring and promotion disparities. To mitigate this:
- Audit Training Labels: Strip out historical performance ratings from managers who consistently scored specific demographics lower.
- Evaluate Disparate Impact: Calculate the Adverse Impact Ratio (AIR). If your model flags protected classes for attrition or stagnation at rates $20%$ higher than the majority baseline, retrain the model and penalize those features.
- Focus on Behavior Over Demographics: Train algorithms on verifiable operational interactions—such as platform use, assessment completions, and meeting load—rather than demographic variables.
What is the typical ROI timeline for implementing predictive analytics in employee training systems?
| Phase | Timeline | Operational Milestone | Financial Impact |
|---|---|---|---|
| Phase 1 | Months 1–3 | Telemetry capture across LMS, HRIS, and Ollasync | Uncovers pipeline gaps; establishes baseline costs |
| Phase 2 | Months 4–6 | Targeted models operational | Reduces training drop-out rates by 15–30% |
| Phase 3 | Months 6–12 | Churn intervention workflows live | Retains 2–5 critical roles per 1,000 employees, offsetting deployment costs |
How can companies deploy these models without violating GDPR or creating a surveillance culture?
Transparency determines whether employees accept predictive modeling:
- Measure Systems, Not Personal Communications: Never scrape personal messages, private Slack DMs, or webcam feeds to assess sentiment. Limit your data pipeline to operational logs, learning metrics, and voluntary surveys.
- Follow Data Minimization Standards: Under GDPR Article 5, ingest only the specific data points needed to predict the target outcome.
- Keep Humans in the Loop: Never automate punitive actions (e.g., performance plans, terminations) based on algorithmic scores. Treat predictive analytics as an internal diagnostic tool that alerts leaders where extra support is needed.